General News Blog
My WordPress Blog
My WordPress Blog

Ever heard someone say, “Trading is just gambling”? Yeah, we’ve all heard that one. Usually from someone who took a wild guess on a meme coin and lost half their savings overnight. But the truth is, trading isn’t about guesswork—it’s about strategy, timing, and most importantly, having the right tools.
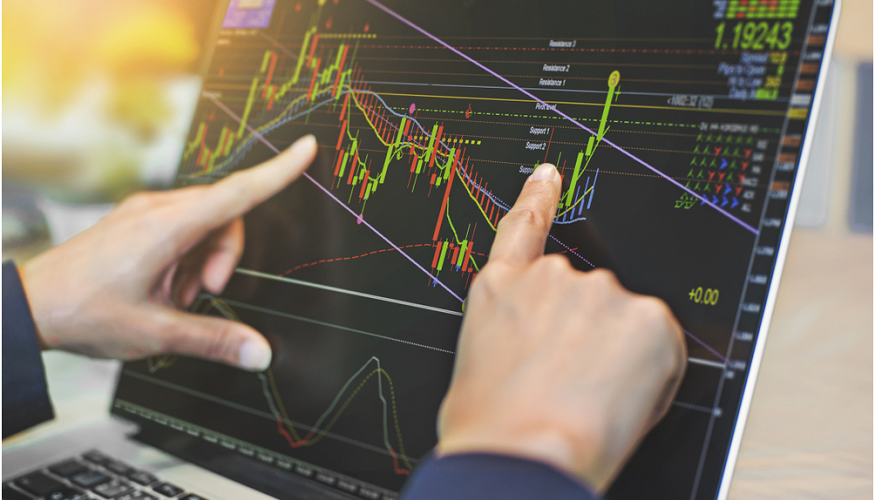
And no tool is more important than charts. Yep, those colorful squiggly lines that seem confusing at first glance? They’re your best friend in the markets. If you’ve ever wondered how to read charts, buckle up. Because once you get a handle on this, trading becomes a whole different game.
Before we dive into the how, let’s talk about the why.
Charts give you a visual representation of price action over time. Instead of staring at a list of prices or scrolling endlessly through historical data, you can glance at a chart and see patterns, trends, and potential reversals. They help you spot where the market’s been, where it might be headed, and when it’s time to enter or exit a trade.
Whether you’re into stocks, crypto, forex, or commodities—charts are your universal translator for market behavior.
There are a few different types of charts, but here are the most popular ones:
Simple and clean. Line charts connect the closing prices of each time period with a line. They’re great for seeing the general direction of a market but don’t give much detail.
These give you more info: open, high, low, and close (OHLC). Each bar represents one period of time (e.g., a day, an hour, etc.), showing how price moved during that period.
This is the go-to for most traders. Candlesticks show the same OHLC info as bar charts, but in a more visual format. Green candles (or white, depending on your chart settings) typically show price went up, while red (or black) means it went down. The “body” of the candle shows the open and close, and the “wicks” show the high and low.
Once you learn how to read charts—especially candlesticks—you’ll never go back to just watching prices update on your phone.
Another key tool in your chart-reading arsenal? Timeframes.
Depending on your trading style, you’ll want to zoom in or out on your charts. Here’s a quick breakdown:
The golden rule? Always start with a higher timeframe to understand the bigger picture, then drill down to the smaller ones for your entries.
When you’re learning how to read charts, identifying support and resistance is like discovering the cheat codes.
These levels are formed based on historical price action. Once identified, they help you predict where price might bounce or get rejected.
Pro tip: Support and resistance aren’t always horizontal lines. They can also be trendlines or even zones.
Once you get comfy reading price action, you can start experimenting with technical indicators. These are tools layered over your chart to help you interpret price in different ways. Some of the most common include:
But here’s the deal: don’t go indicator crazy. Some traders slap 10 indicators on a chart and end up in analysis paralysis. Start simple—price action + one or two indicators max.
Once you know how to read charts, you’ll start seeing recurring patterns. These aren’t random—they’re a reflection of trader psychology. A few to know:
These patterns won’t guarantee a win, but they definitely increase your odds when used with other tools like support/resistance and indicators.
One chart tool that often gets overlooked? Volume.
Volume shows you how much of an asset is being traded. A big price move with high volume is more trustworthy than one with low volume. It confirms that there’s real interest behind a move—not just a few whales playing games.
If you see a breakout happening, check the volume. No volume = probably a fakeout. High volume = potential real deal.
Reading charts is a skill. You won’t master it overnight—but the good news is, you don’t need to. With a little consistent practice, you’ll start recognizing patterns and key levels without even thinking.
Start by picking one asset (say, Bitcoin or Apple stock), look at its chart across different timeframes, draw your support/resistance zones, and identify the trend. Do this every day. Over time, your eyes will get sharper and your decisions more confident.
And remember: trading isn’t about predicting the future—it’s about reacting to what the market is telling you now.
Trading can absolutely be simple—but only if you equip yourself with the right tools. Understanding how to read charts is foundational. It’s what separates the gamblers from the strategists, the panic sellers from the patient buyers.
So next time you open up a chart, don’t just see squiggly lines—see a roadmap. With every candle, every pattern, every support zone, the market is speaking to you. All you’ve got to do is learn the language.
And trust me, once you do, trading becomes a whole lot more fun.